


Top 10 Chart Patterns Every Trader Should Know
Understanding chart patterns is crucial for traders in any financial market. Recognizing these patterns helps in predicting future price movements, making them a fundamental aspect of technical analysis. In this blog post, we’ll delve into the top 10 chart patterns every trader should know, ensuring that you can apply this knowledge to enhance your trading strategy.
Head and Shoulders Pattern
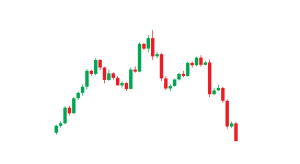
One of the most reliable chart patterns is the Head and Shoulders pattern. It signifies a reversal in the current trend and is characterized by a peak (the head), with two lower peaks (shoulders) on either side. Traders often view this pattern as a signal to sell.
Inverse Head and Shoulders
The inverse head and shoulders pattern is the opposite of the head and shoulders, indicating a bullish reversal. It features a trough (head) flanked by two shallower troughs (shoulders). This pattern is commonly interpreted as a buy signal.
Double Top and Double Bottom

These chart patterns are essential for spotting reversals. The double top appears at the end of an uptrend and resembles the letter ‘M’. Conversely, the double bottom, resembling a ‘W’, forms at the end of a downtrend. Both are pivotal for traders to identify potential shifts in market momentum.
Triangles

Triangles are continuation chart patterns, formed by converging trend lines and are typically identified in three types: ascending, descending, and symmetrical. They indicate a period of consolidation before the price breaks out. Traders use these patterns to predict the direction of the breakout.
Bullish and Bearish Flags

Flags represent brief pauses in a dynamic market trend. A bullish flag appears in an uptrend and resembles a downward-sloping rectangle, while a bearish flag in a downtrend appears as an upward-sloping rectangle. Both patterns are significant for traders to forecast the continuation of an existing trend.
Pennant

Similar to the flag, the pennant chart pattern is formed after a strong movement in price. It is characterized by converging trend lines that take a small symmetrical triangle shape. This pattern suggests that traders can expect a continuation of the trend preceding the pennant.
Cup and Handle

The cup and handle pattern is a bullish continuation chart pattern resembling a teacup. The ‘cup’ forms after an uptrend and is followed by a smaller ‘handle’. This pattern indicates a pause in an uptrend before it continues, offering a potential buy opportunity.
Falling and Rising Wedges

Wedges are chart patterns indicating either a reversal or continuation. A falling wedge usually signals a bullish reversal or continuation, while a rising wedge could indicate a bearish reversal or continuation. Understanding these patterns helps traders anticipate potential market movements.
Rectangle

Also known as the consolidation zone, the rectangle chart pattern forms when the price is bounded by parallel support and resistance levels. This pattern suggests that the market is consolidating, and a breakout is imminent. Traders often use rectangles to identify buy or sell signals based on the breakout direction.
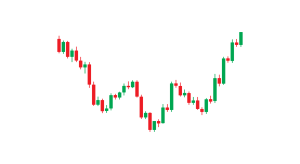
Round Bottom

The round bottom chart pattern, often referred to as a “saucer bottom,” is a long-term reversal pattern that signals a shift from a bearish to bullish trend. It is characterized by a gradual and rounded decline followed by a steady ascent, signaling a steady shift in market sentiment.
In conclusion, understanding these top 10 chart patterns is essential for traders in any market. These patterns provide valuable insights into market psychology and help predict future price movements. Whether you are a seasoned trader or just starting, integrating chart patterns into your analysis can significantly enhance your trading decisions. Remember, successful trading requires not only knowledge of chart patterns but also discipline, patience, and a well-thought-out trading strategy. Keep practicing, and you’ll be able to spot these patterns more easily, gaining an edge in your trading endeavors.


